Ops Intelligence Hub
BI dashboards show what happened. This one tells you what to do about it, and shows its working.
Two systems built side by side. The first: deterministic workforce analytics with AI-generated recommendations where every claim traces back to its source data. The second: an LLM-driven synthetic world built to validate the first, with a deterministic baseline to reset from.
How it started
I've spent years accounting for where hours went, arguing for budget adjustments, and fighting time registration structures that were too fine-grained to be useful. The data existed, but the analysis was always manual: spreadsheets, gut feel, and executive summaries that cherry-picked data points with no traceability. I wanted to build the analysis tooling I wished I had.
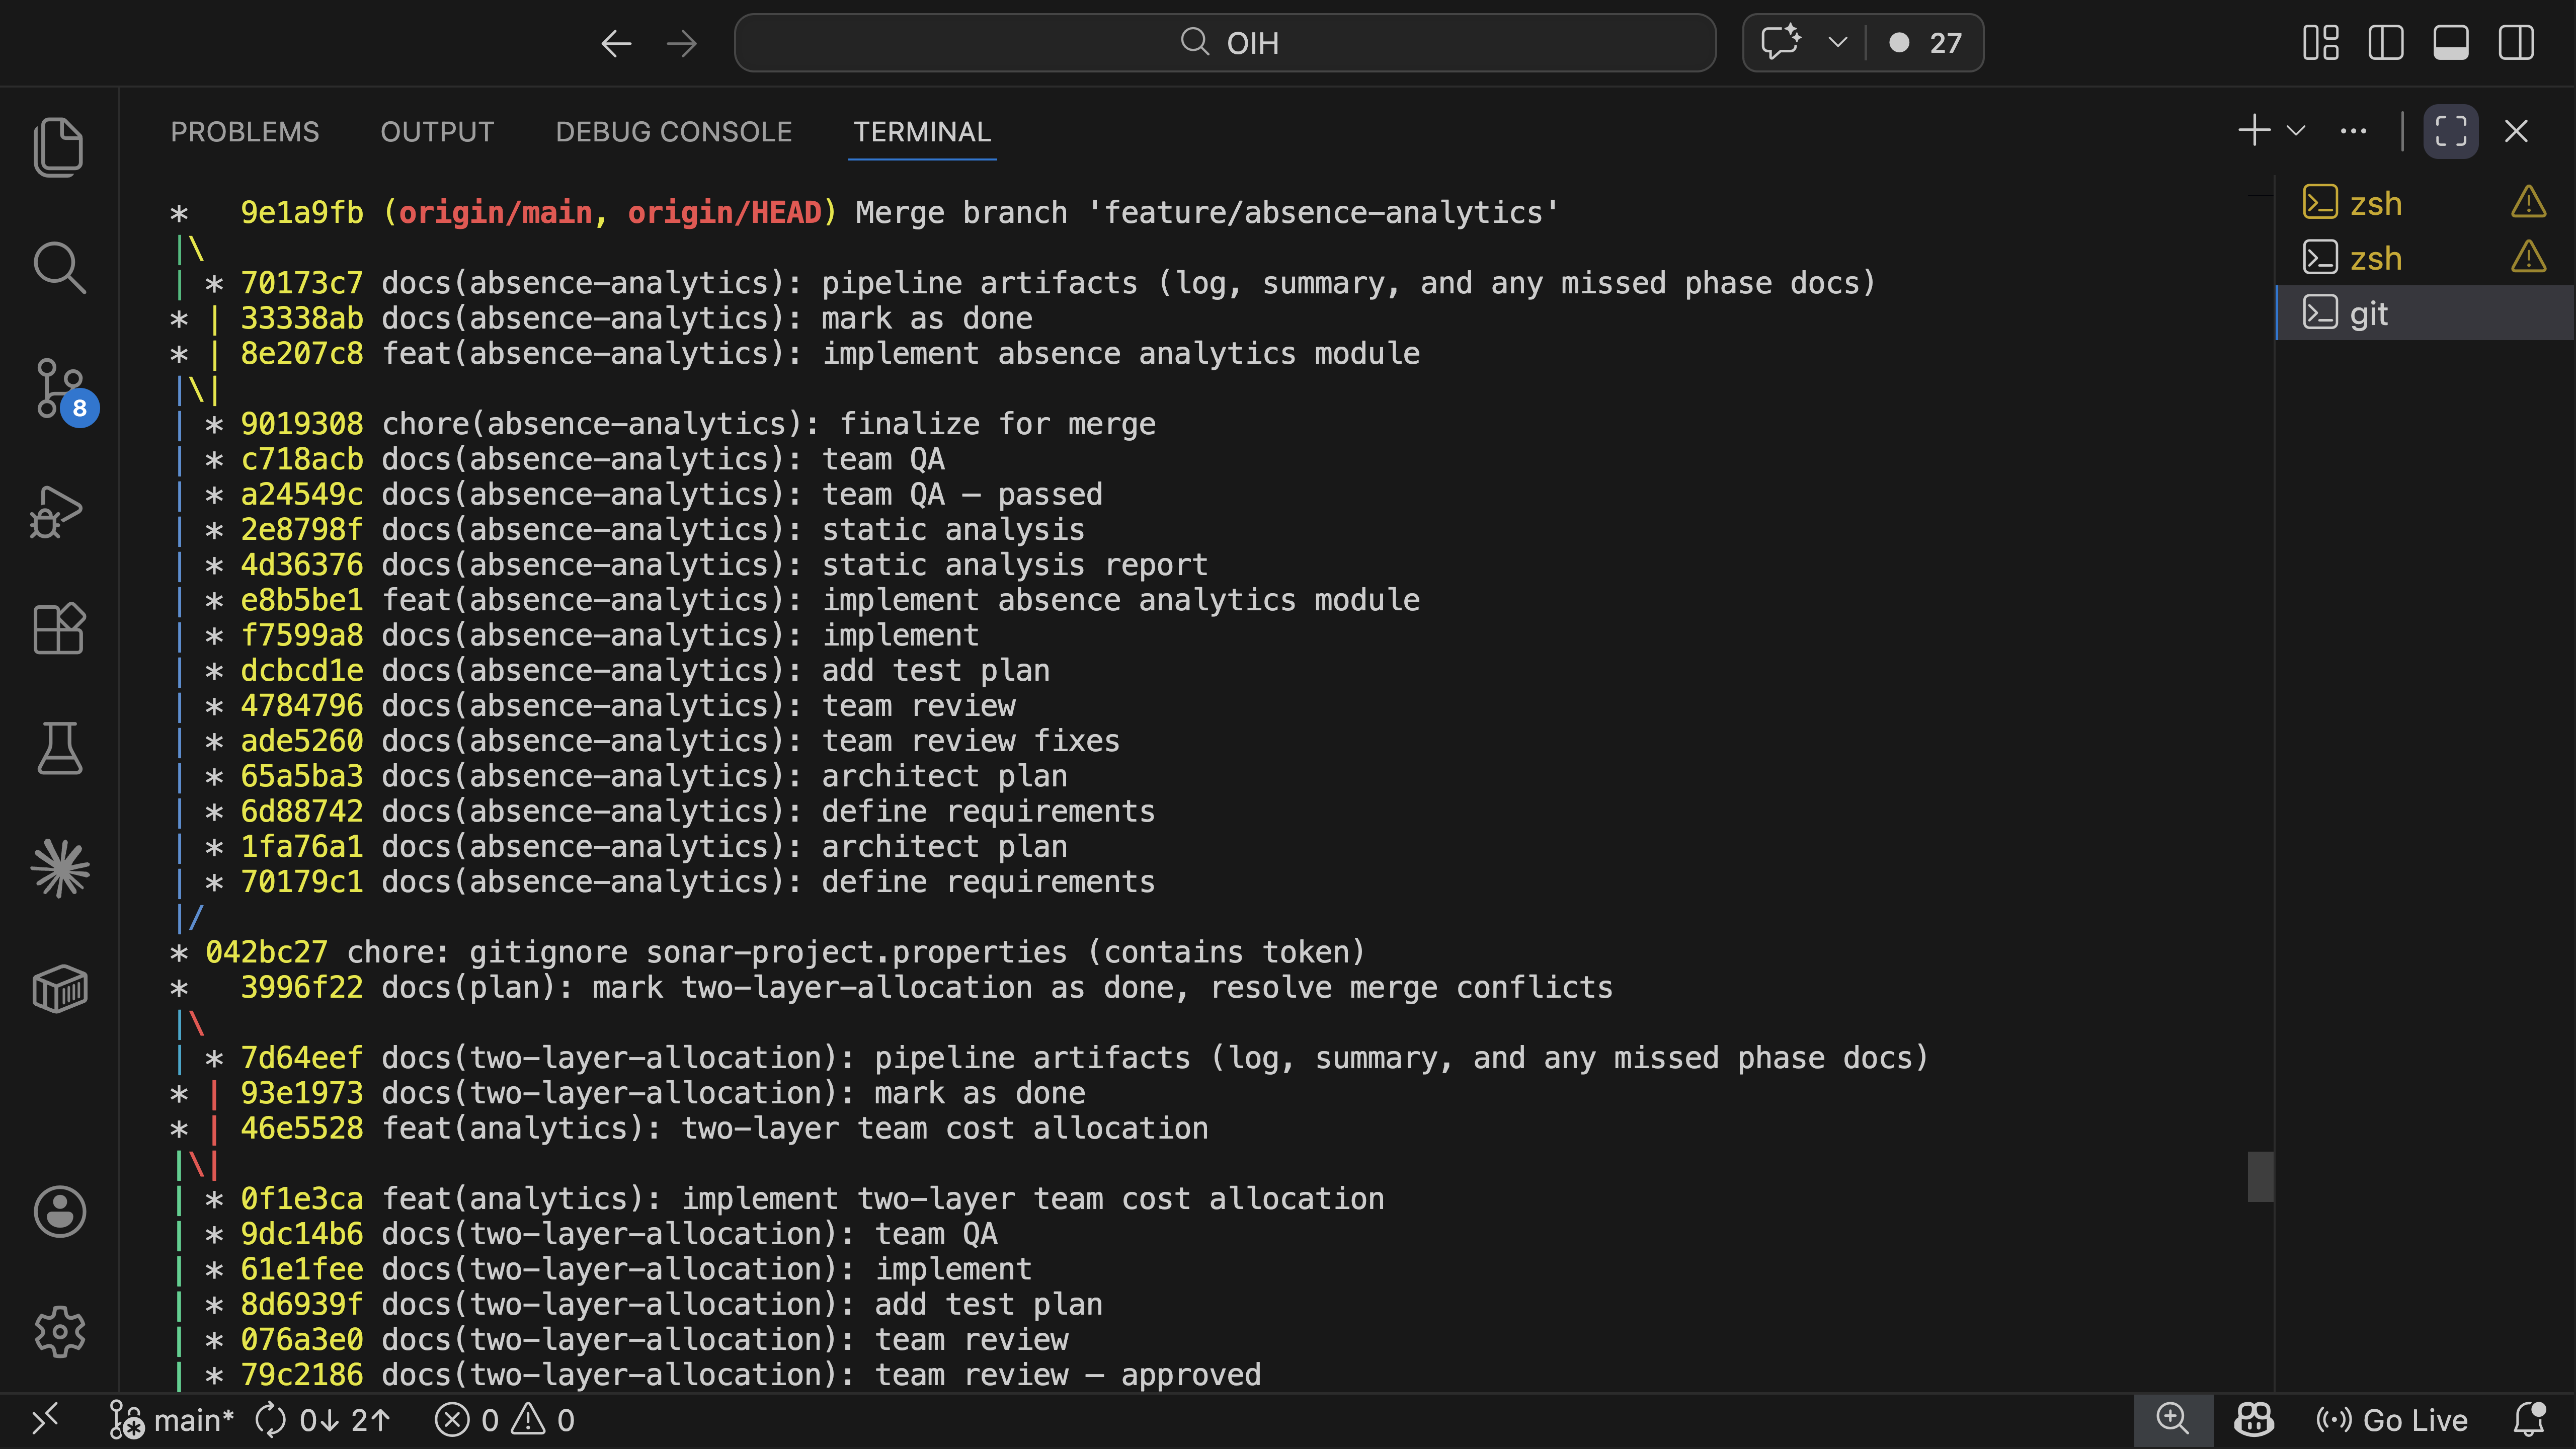
OIH is also the project where autopilot mode in the Claude Code Pipeline was built and tested. The backend work ran unattended through the pipeline while I focused on the parts that needed human judgement.
What it does
The system has three layers, and the separation between them is the point.
11 analytics modules. Pure functions, no side effects, config-driven thresholds. Same input, same output, every time.
Agents never compute. They call tools. Tools call analytics. The numbers are always deterministic.
No AI recommendation reaches a stakeholder without documented human review. Evidence is immutable after approval.
When someone challenges a recommendation ("Why should we move two people to Team B?"), the claim traces through the agent's reasoning, through the tool call, down to the specific analytics function and the exact data rows it processed.
This separation matters because traceability is not optional in financial services. When agents compute, their outputs are non-reproducible. When agents interpret deterministic results, every claim can be verified independently.
Two systems, not one
The OIH system analyses workforce data and recommends actions. But how do I test whether those recommendations are any good? I needed a second system: a synthetic world that the first system operates on, where I can run scenarios, observe consequences, and reset to baseline.
GDPR constraints meant I couldn't use real workforce data. So I built a synthetic organisation: 220 employees across six departments in a fictitious Nordic fintech, with five years of timesheets, allocations, absences (with Danish categories: holiday, sickness, parental leave, care days, education), and budgets. A two-layer cost allocation model distributes employee time across cost groups (AMS, Portfolio, Non-billable, Added Value) through team-level splits. The data generator is deterministic: same seed, same output, every run.
Seven realistic problem scenarios are embedded in the generated data: the ML Platform team running at 112-130% utilization in Q3-Q4 2024, portfolio budget pressure, Backend Core with 40% missing timesheet entries, a bench period after a project ends, cost allocation drift between AMS and Portfolio, systematic overtime across multiple teams, and external dependency concentration. These aren't edge cases. They're the patterns I've seen repeatedly over 25 years. This isn't sample data. It's a test harness designed to stress every analytics module.

Data viewer: the synthetic organisation with departments, teams, and the two-layer allocation model. Tap to expand.
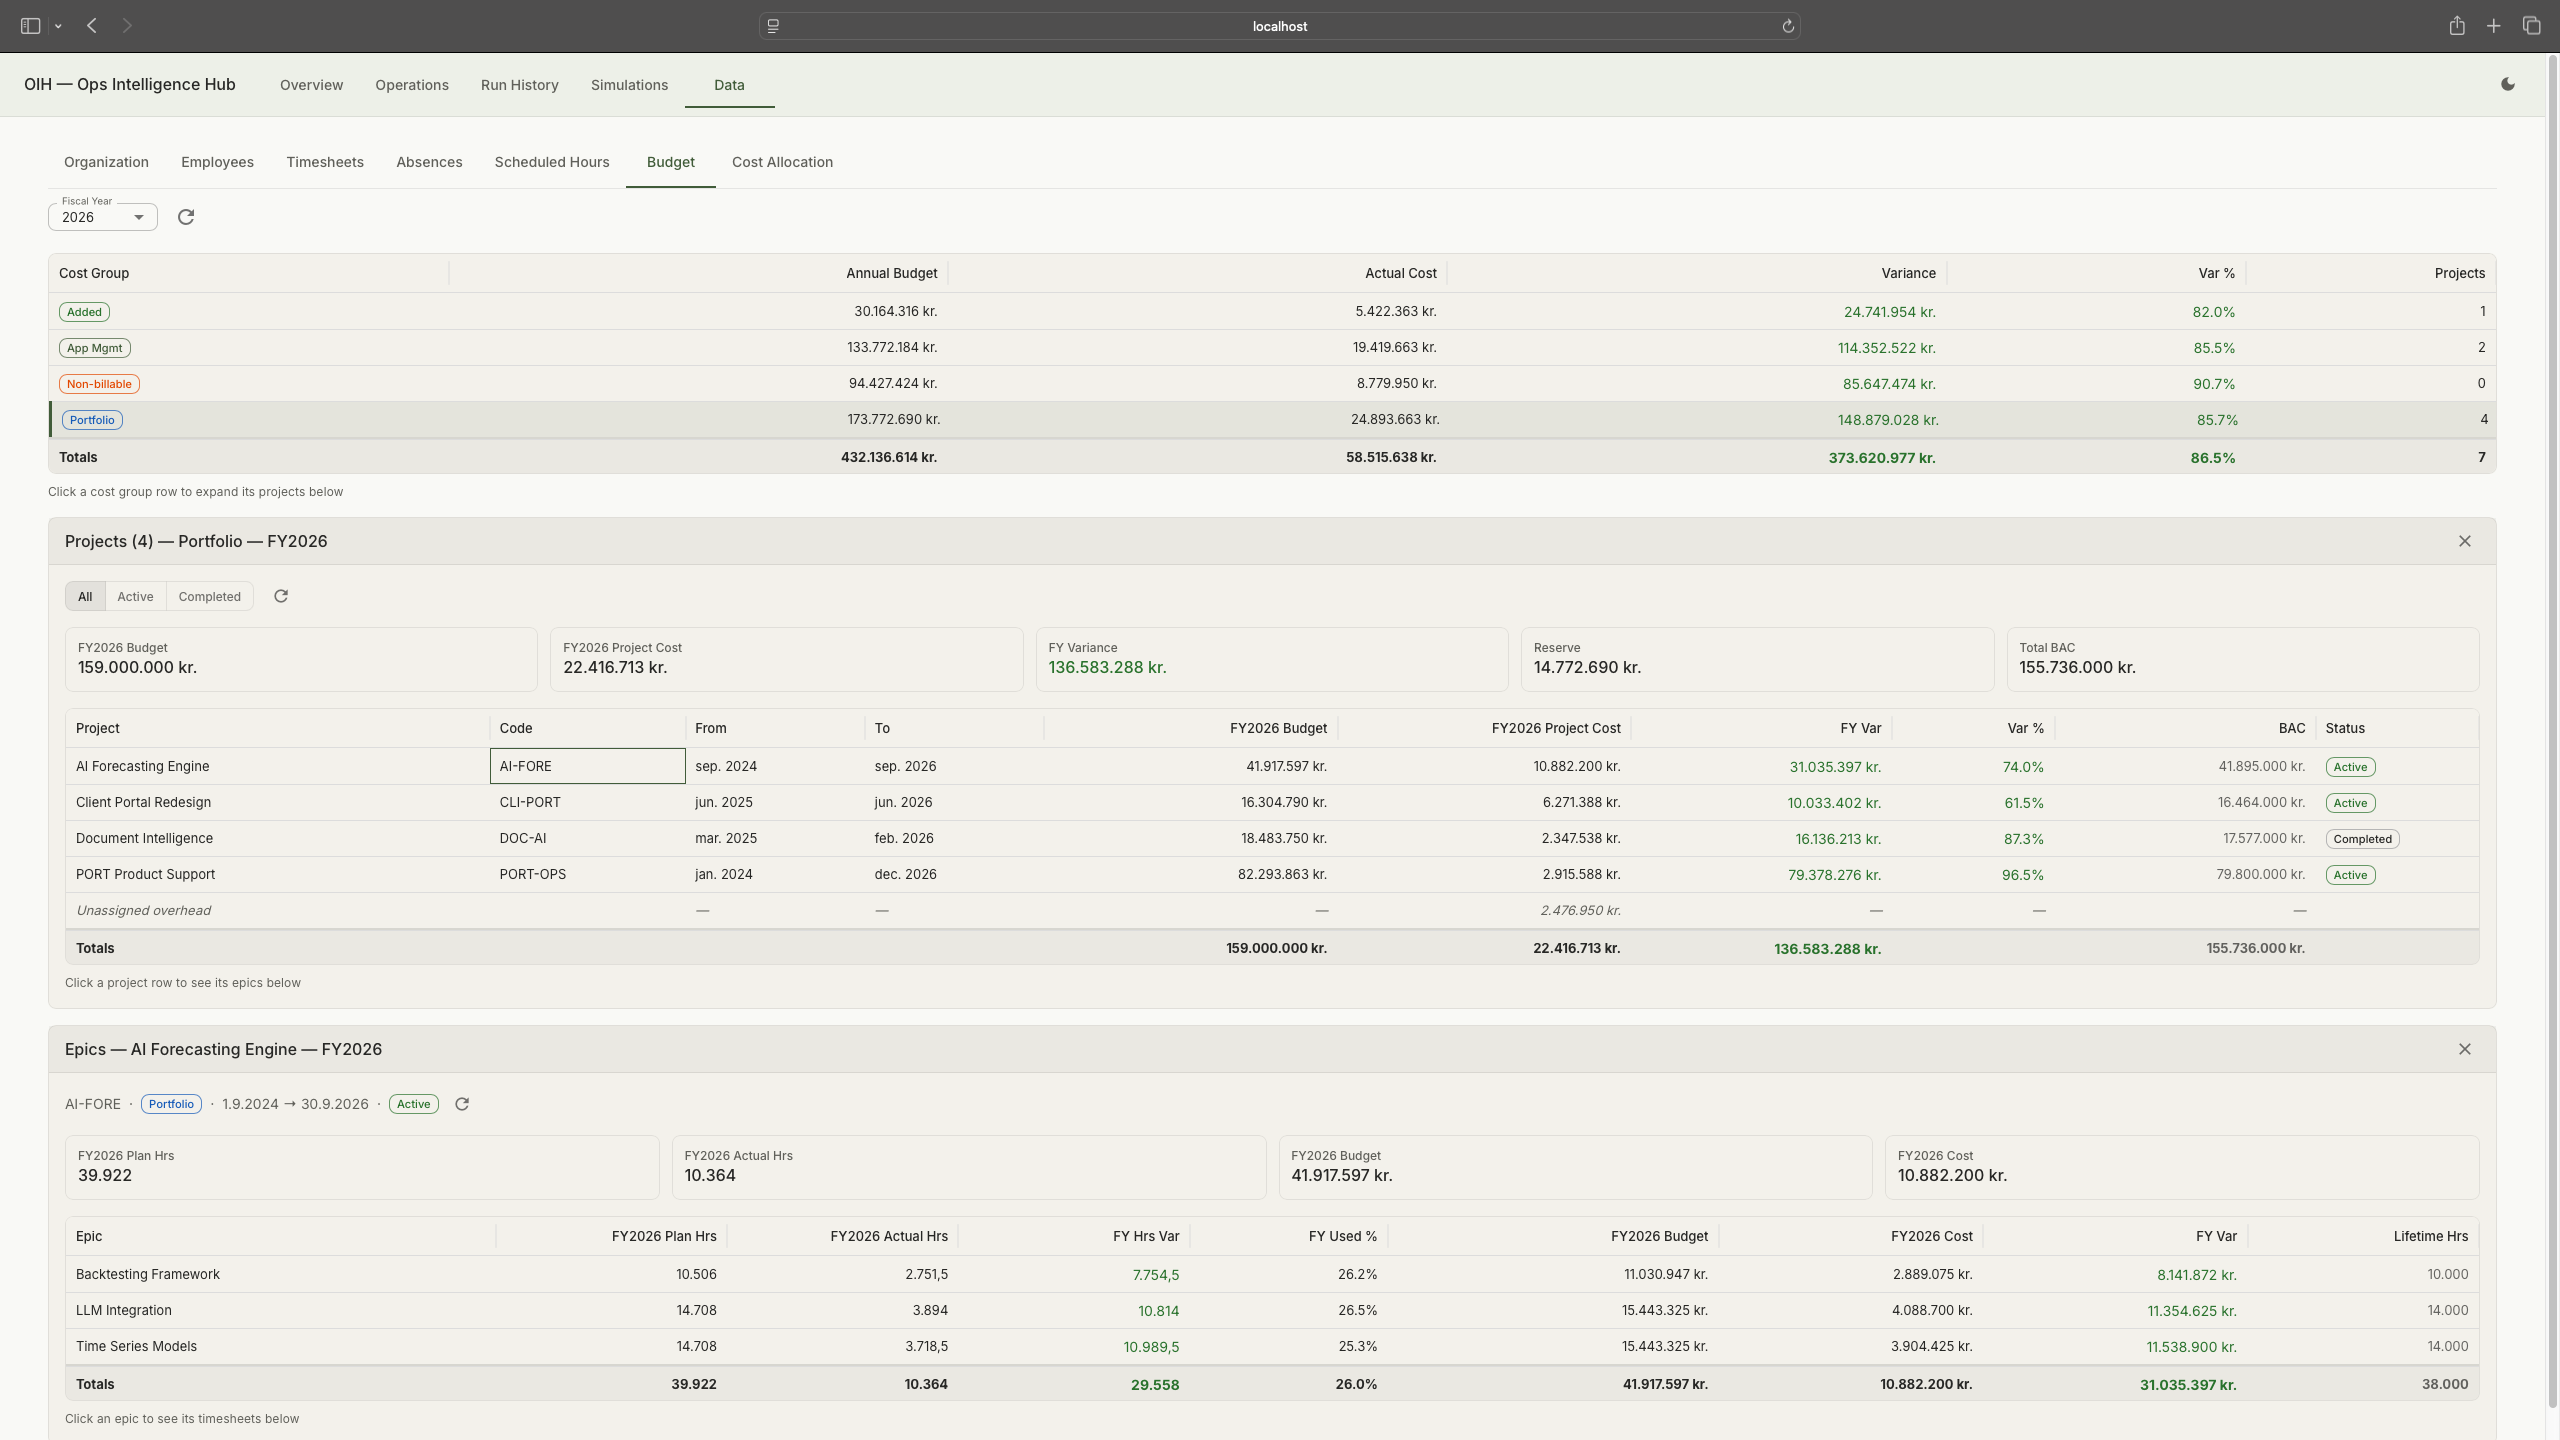
Budget data: cost groups, project allocations, and epic-level breakdown. Tap to expand.
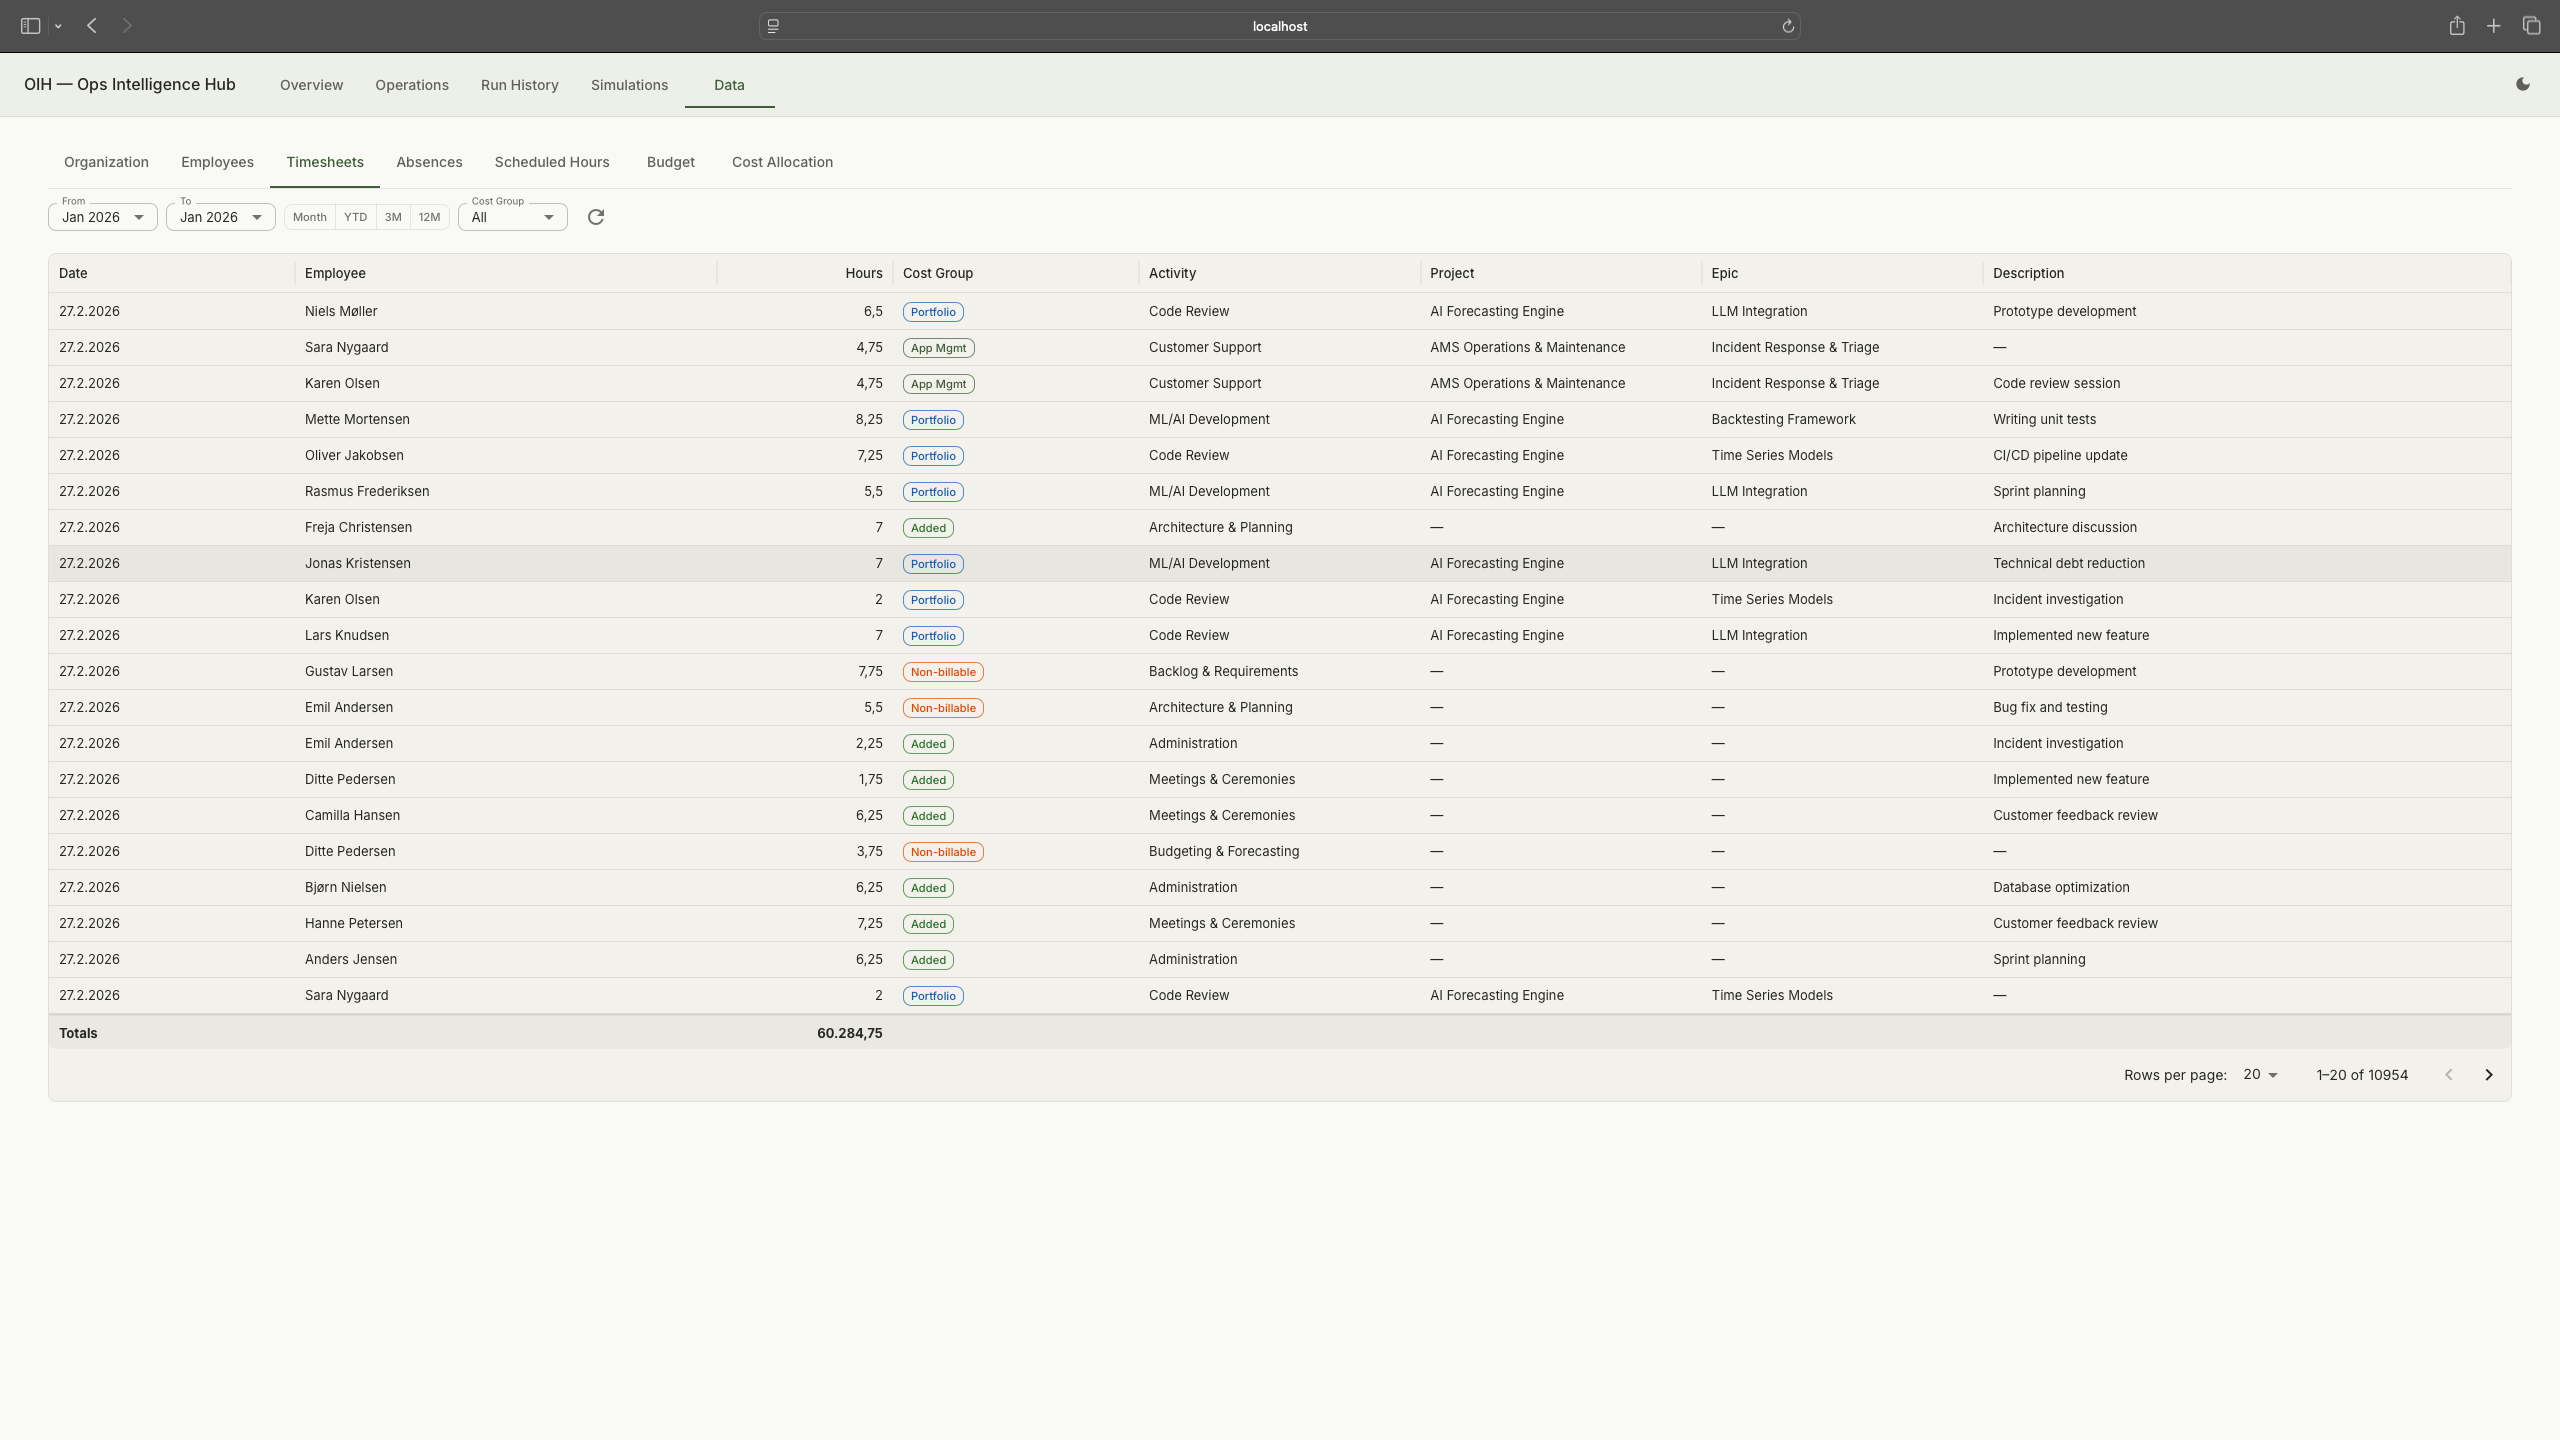
Five years of generated timesheets: date, employee, hours, cost group, activity, and project. Tap to expand.
Simulating decisions
Static test data can verify that analytics modules compute correctly, but it can't verify that the system handles a changing organisation over time. The simulation engine is the next piece I'm building. It closes the loop: take the OIH system's recommendations, apply them to the synthetic organisation, and play the consequences forward.
Organisational decisions don't land cleanly. Moving two people to a new team doesn't guarantee full productivity on day one. Hiring takes longer than planned. A parental leave creates a gap that ripples through allocations. The simulation engine will model these effects with realistic variance: some actions have the intended effect, some partially, some create side effects. This is where the LLM fits naturally. It generates plausible variation in outcomes, not exact predictions. The simulation will run turn by turn, not just once. Each turn advances the organisation forward: new timesheets, absences, allocations. New problems emerge. The OIH system analyses again. Over multiple turns, it simulates a living organisation evolving over months. And because the baseline data generator is deterministic, I can always reset to a known starting point and run a different sequence of decisions.
Each cycle tests whether the system's recommendations actually help. The simulation is the test harness, not the product.
I could see this approach being useful in many projects: building a synthetic environment alongside the system so it can be tested under conditions that resemble reality, not just against static fixtures.
Design decisions
- No classifier, no dynamic routing. Seven fixed analysis scenarios. A classifier adds latency and failure modes for no benefit when the scenario set is known.
- No vector database. 100% structured data. Adding RAG to a system with deterministic queries would add complexity without adding value. EuLex is the RAG project.
- Run-based, not chat-based. Each analysis is a complete, independent run. No conversation history. State is ephemeral within a run and persisted to PostgreSQL.
- Config-driven thresholds. All business rules in YAML, not code. "Over-allocated" means >110%, and that number lives in a config file, not buried in Python.
- EVAL = PROD. The same principle from EuLex: the evaluation framework calls the exact same code paths as the production API. Seven scorers, built incrementally as each became testable against real data.
Reflections
This is the project closest to the work I've done professionally. The problem is real, the data patterns are real, and the frustration that motivated it is real. Building it on synthetic data with embedded scenarios turned out to be an advantage, not just a GDPR workaround. The scenarios are reproducible, the analytics modules can be tested against known ground truth, and the whole system can be demonstrated without access to anyone's actual workforce data.
The pattern I keep coming back to is the same one from the pipeline and dashboard: separate what the AI generates from what verifies it. In the pipeline, deterministic tools verify AI-generated code. In the dashboard, structured data provides the audit trail. Here, deterministic analytics produce the numbers and AI agents interpret them. The AI is valuable for synthesis and recommendations. It's not trustworthy for computation. Every project has reinforced that distinction.
What went wrong
The biggest lesson: I should have started with the data. I built analytics modules, agent orchestration, and UI components before the synthetic data model was solid. That meant constantly retrofitting as the data shape changed. Everything in a system like this starts with data. The structure of the timesheets, the allocation model, the absence categories. Getting those right first would have saved weeks of rework. It's the kind of mistake that sounds obvious in hindsight, but the pull to build the interesting parts first is strong.
A smaller but painful lesson: the LLM observability tool (Langfuse) initially shared a database with the application. A routine database reset during development wiped all the observability data along with it. Observability data is production data. It gets its own database.
Repository
Available when the project reaches a presentable state